Bitcoin Option Markets Keep Sending Bullish Signals – Here’s the Implications for BTC Price

[ad_1]

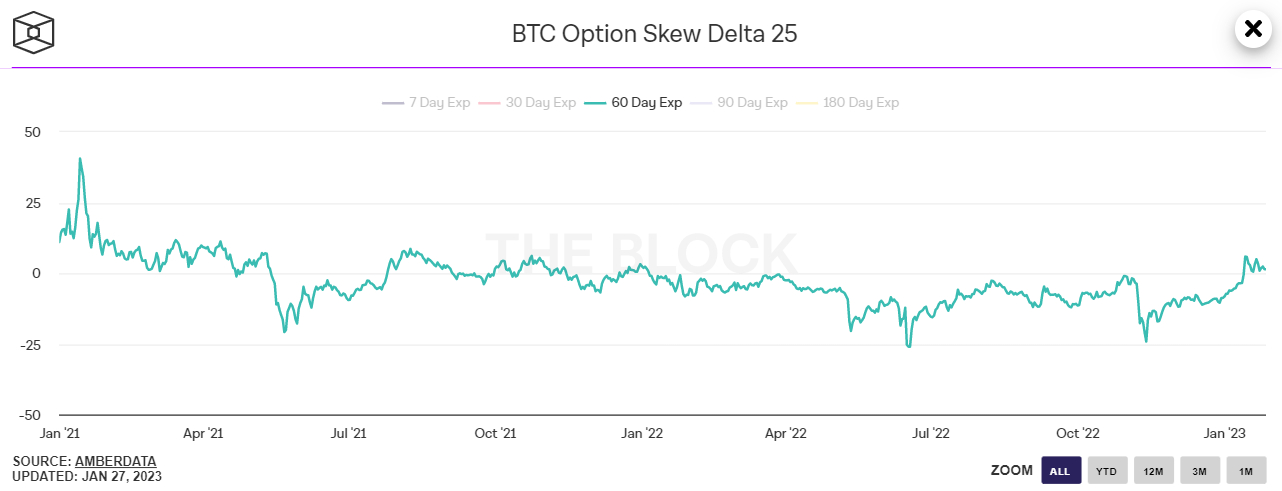
Bitcoin options markets continue to signal that investors are anticipating further upside in the BTC price. According to a chart on The Block, the widely followed Bitcoin 25% delta skew has remained above zero since the middle of January and recently hit its highest since Q4 2021 at close to 6.0.

The 25% delta options skew is a popularly monitored proxy for the degree to which trading desks are over or undercharging for upside or downside protection via the put and call options they are selling to investors. Put options give an investor the right but not the obligation to sell an asset at a predetermined price, while a call option gives an investor the right but not the obligation to buy an asset at a predetermined price.
A 25% delta options skew above 0 suggests that desks are charging more for equivalent call options versus puts. This implies there is higher demand for calls versus puts, which can be interpreted as a bullish sign as investors are more eager to secure protection against (or bet on) a rise in prices.
Open Interest Put/Call Ratio Also Points To Strong BTC Sentiment
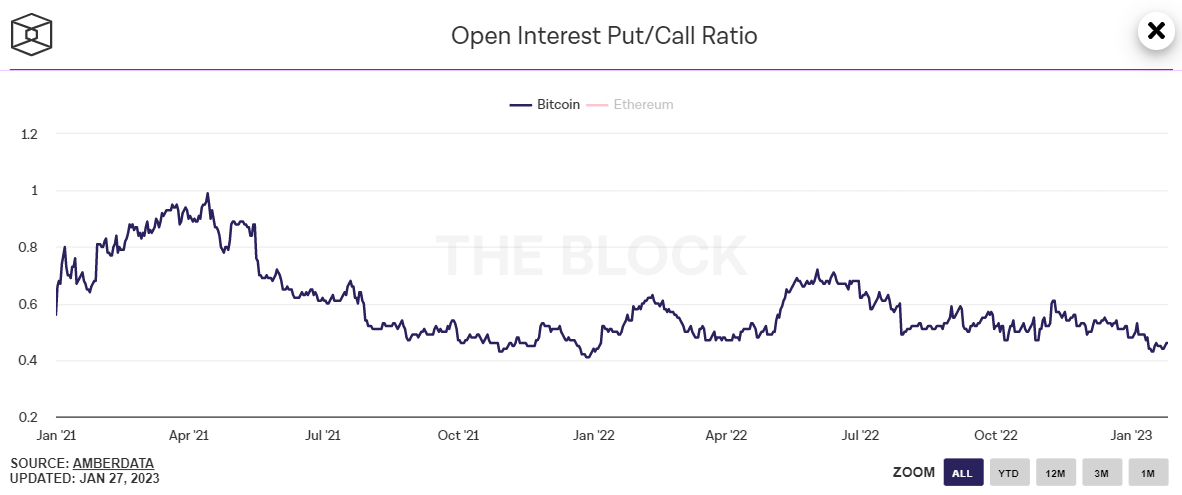
The sustained rise in Bitcoin’s 25% delta option skew is a sign that investor sentiment towards the world’s largest cryptocurrency by market capitalization has taken a substantial turn for the better in January. Another options market indicator called the Open Interest Put/Call Ratio is also signalling a recovery in sentiment.
According to a chart on the Block, the ratio between open BTC put and call options on derivatives exchange Deribit was last at 0.46, close to its lowest since January 2022. It spiked as high as 0.61 in the immediate aftermath of the FTX cryptocurrency’s collapse in early November.

Investors Betting That the Bear Market is Over?
Bullish signals regarding the kind of protection investors are demanding in the Bitcoin options market add to a growing list of reasons why investors, analysts and commentators alike are increasingly taking the view that the latest rebound in Bitcoin’s price may not just be another so-called “bear market rally”, as happened time and time again in 2022, but could be the start of a broader market recovery.
As covered in a recent article, six out of eight indicators watched by analysts at crypto data analytics platform Glassnode to identify when Bitcoin is transitioning out of a bear market are flashing bullish signals, and a seventh is likely to also soon turn green.
Meanwhile, 2022’s macro headwinds appear to be abating. US inflation is fast dropping to more acceptable levels and with the US economy grinding to a halt as per recent survey data and corporate earnings, the bond market’s assessment that the Fed won’t be able to tighten rates much more in 2023 is looking like an increasingly accurate call.
This narrative has been a key driver of Bitcoin’s 2023 rally so far, and many think could further support its price in the months ahead. While some continue to deride the latest move higher as just another bear market rally, the above-noted indicators in Glassnode’s dashboard suggest that this latest move higher could well be something more.

Additional Signs of Market Recovery
Elsewhere, the widely followed Bitcoin Fear & Greed Index recently moved back into neutral territory (i.e. above 50) for the first time after a prolonged spell of Fear and Extreme Fear. A lasting recovery back into neutral often comes at the beginning of the next Bitcoin bull market, such as in early 2019 and then again in mid-2020.
Meanwhile, analysis from crypto-focused Twitter account @CryptoHornHairs made a jaw-dropping observation that Bitcoin is following almost exactly in the footsteps of a near-four-year market cycle that it has been following for the past more than eight years. After bottoming last November, Bitcoin may rally for another nearly 1000 days, the analysis suggests, before entering its next bear market in 2025.
Additionally, a widely followed Bitcoin pricing model is sending a similar story. According to the Bitcoin Stock-to-Flow pricing model, the Bitcoin market cycle is roughly four years, with prices typically bottoming somewhere close to the middle of the four-year gap between “halvings” – the Bitcoin halving is a four-yearly phenomenon where the mining reward gets halved, thus slowing the Bitcoin inflation rate. Past price history suggests that Bitcoin’s next big surge will come after the next halving in 2024.
[ad_2]
Source link
